Introduction to vSAN Performance Service
VMware introduced vSAN performance service back in vSAN 6.2 which vSAN administrators can leverage to monitor the performance of an vSAN environment. vSAN performance service collects and analyzes performance statistics and displays the data in a graphical format.
You might ask, why VMware introduced vSAN Performance Service to troubleshoot vSAN performance issues when we already have VSAN Observer to troubleshoot vSAN performance issues. Even though vSAN Observer is a great tool but have some limitations like
- VSAN observer doesn’t provide historic data and provides only the real-time status of the system.
- VSAN Observer ran on its own web service separately and is not integrated with vSphere Web Client.
- VSAN Observer provides lot metrics which sometimes requires experts skill sets to understand
- Impact on vCenter Server.
- Have to enable manually from the RVC Cli
- No API Access
VMware tried to address all of these limitations with the Virtual SAN performance service. Secondly, VMware vSAN performance service does not require the use of vRealize Operations Manager or the vCenter database. Instead, Virtual SAN performance service uses the Virtual SAN object store to store its data in a distributed and protected fashion.
Configuring vSAN Performance Service
When you create a vSAN Cluster, performance service is disabled by default.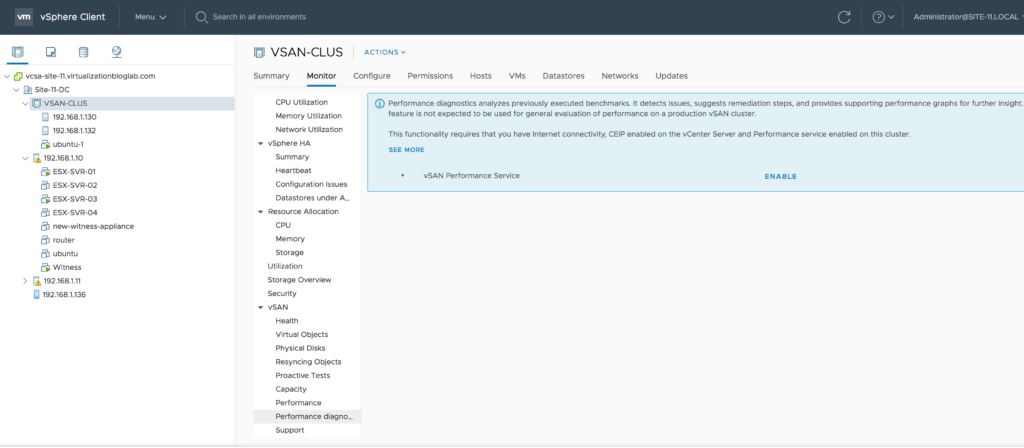
You need to turn on the performance service to monitor vSAN Cluster, hosts, disks and VM’s.
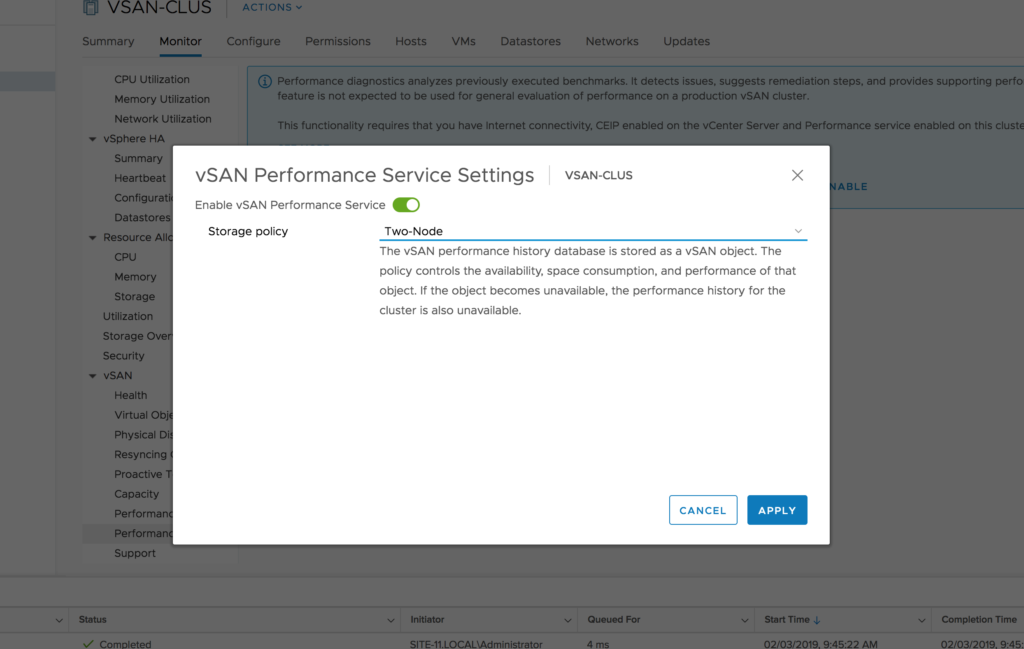
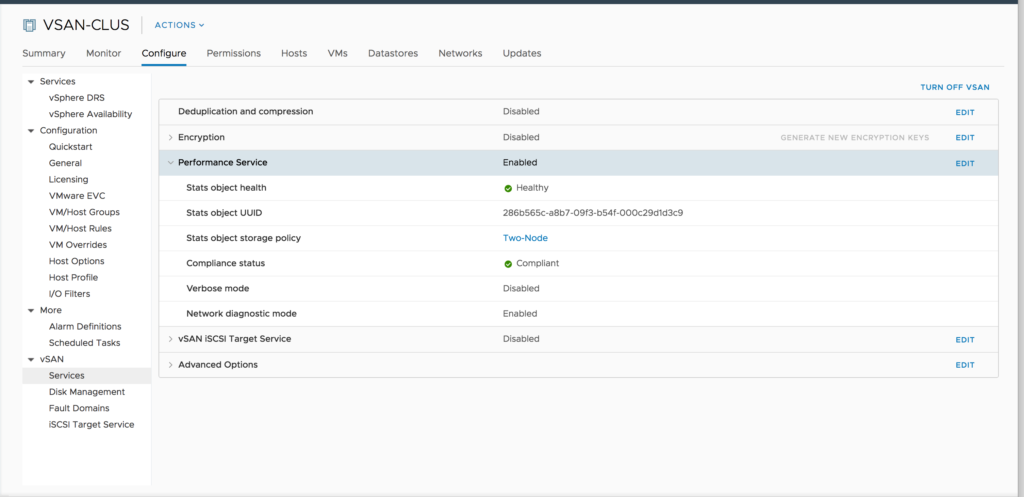
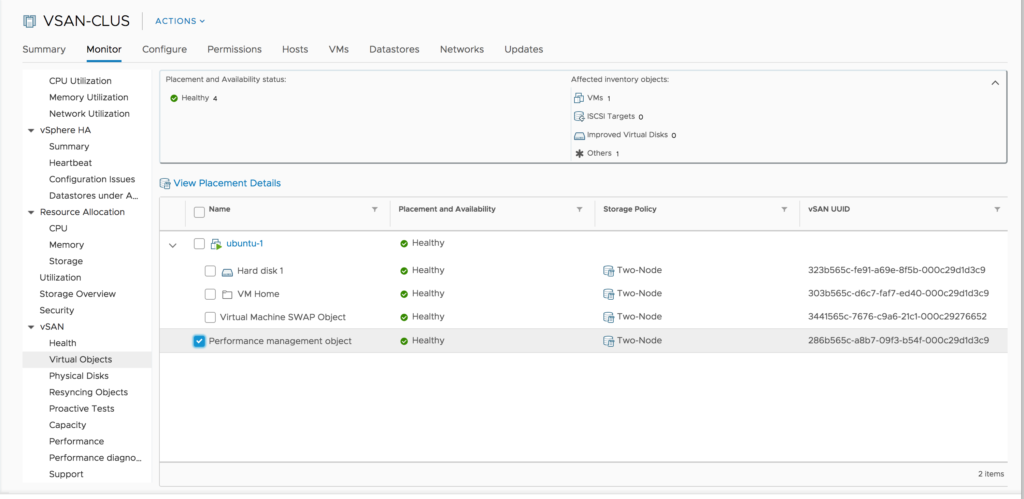
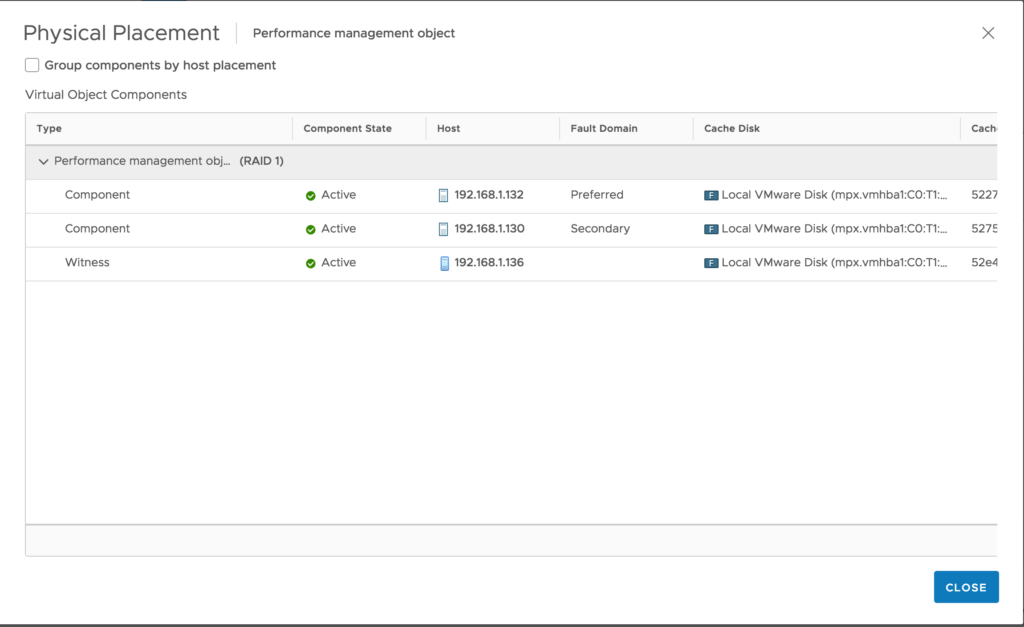
You can modify the time range from the last 1-24 hours or a custom date and time range. It is also possible to save performance data for later viewing. Once you enable the performance service it database is stored as a vSAN object independent of vCenter and a storage policy is assigned to the object to control availability and space utilization of that object.
Hope this will be informative for you. Please share if you find worth sharing it.
